UI/UX- Platform Redesign
Reimagining Dealership Management
in a Unified SaaS Platform
To reimagine and redesign the existing automobile platform into a visually appealing, intuitive, and role-centric experience that increases feature adoption, reduces user friction, and brings clarity to task flows — all without disrupting the platform's existing functionality.
Scope
Industry Led Live Project
Industry
Automotive
Duration
3 Month
Tools
Figma,Adobe Photoshop,Useberry
Setting the Stage
Lets Dig Into it
Research Methods

User Interview

-Interviewed 50+ users across different dealerships, consisting of MIS, EDP, CEO, CTO & Dealership Principles
-Combined qualitative interviews and surveys to gather insights.
-Focused on daily workflows, data pain points, and feature usage.
-Explored expectations around usability, AI, and reporting.

Stakeholder Interview

Dashboard usability issue
Data upload & mapping pain points: Complex workflows, frequent errors, 15MB file limits
Interface confusion: Users often don’t know where to click; error messages and help indicators are not prominent.
Customization: Users want drag-and-drop widgets, personalized views, and more filter options
Overall data uploading process is slow and frustrating.
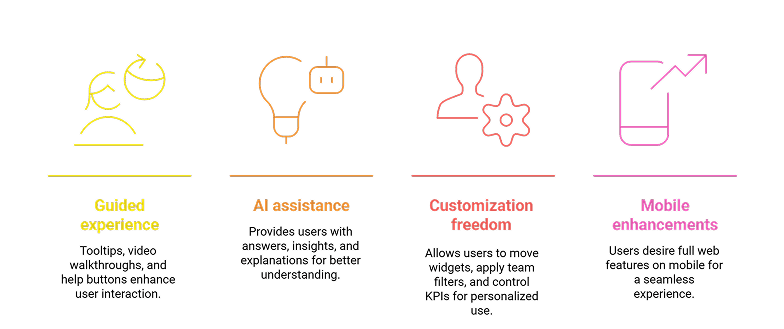
Key User Needs
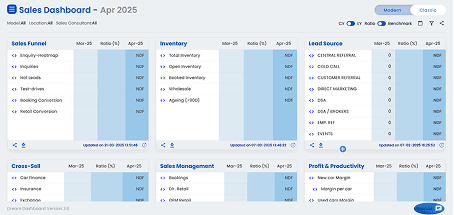
Smart Dashboards: Intelligent, color-coded visualizations with dynamic charts, predictive analytics, and pre-saved custom views.
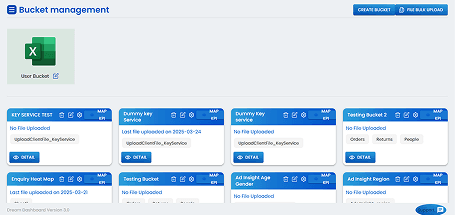
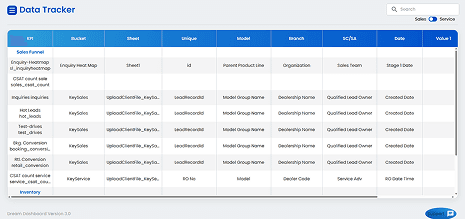
Efficient Data Handling: Simplified data entry, version control for datasheets, and easy access to frequently used reports.
Robust System Support: Error messages with guided steps, data backup and recovery, and intuitive file management.
Smooth Navigation: Easy search and navigation to boost user efficiency.
Common behaviours and patterns
Role-Specific Usage: Different roles have varying needs, from daily data uploads and monitoring for operational roles to high-level strategic oversight for CEOs
Desire for Customization: Users across roles express the need for better dashboard customization to improve relevance and ease of use.
Data Management Frustrations: Issues with file size limits and slow uploads are common, pointing to the need for optimization in data handling
Manual Workarounds: Users often rely on manual processes, especially when data formatting is inconsistent or uploads fail.
Major Pain Points
Manual data validation
Limited analytics capabilities
File size limitations
Poor error messaging
Slow upload/download speeds & Version tracking difficulties
Inadequate export options
Market Research
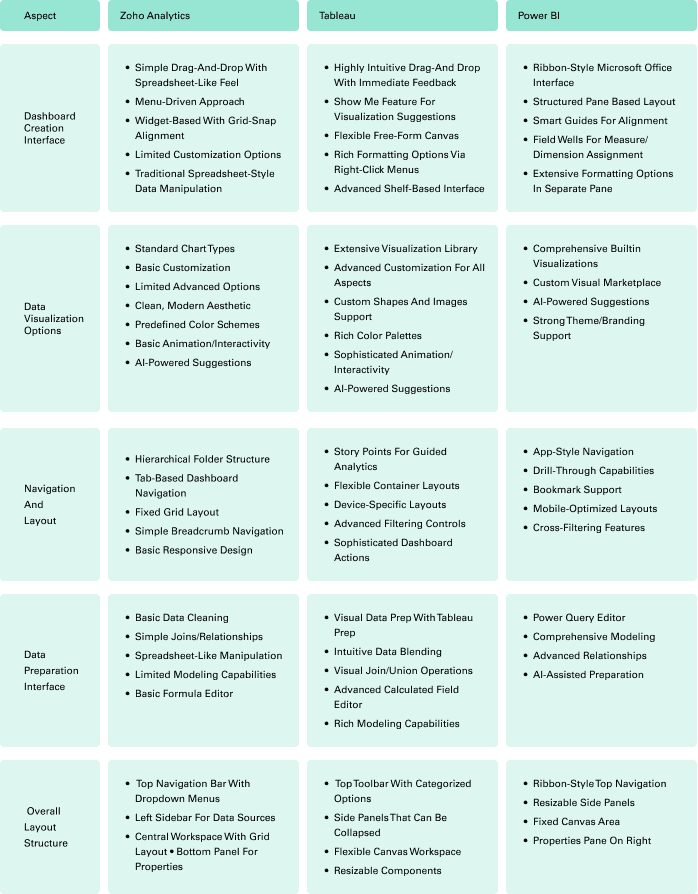
-Zoho Analytics provides user-friendly interface, better AI insights and minimal and clean layout.
-Tableau dominates with advanced visualization, better organisation of data sheets but has steep learning curve.4
-Power BI offers Excel-like familiarity, strong drill-through features, and Microsoft integration.
Priority recommendations
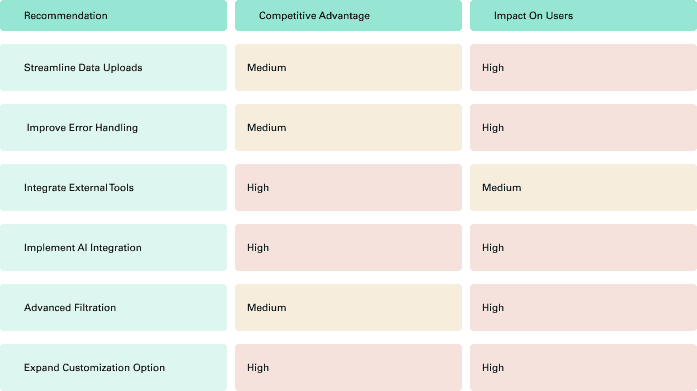
Opportunities for improvement
Streamlining Data Uploads
Address:
Limited file size restrictions, missing/incomplete data from source systems
Implement:
-Expanded file upload capabilities
-Automated data validation and completion
-Multi-system data synchronization
Advanced Customization
Address:
Limited dashboard customization, difficulty tracking across multiple systems
Implement:
-Flexible dashboard configuration by own
-Role-specific view and advanced filter options
Cross-Tool Integration
Address:
Integration problems between multiple software solutions
Implement:
-Develop robust API connectors for Excel data import/export capabilities
-CRM system synchronization
Connecting Dots

Kamlesh Mehta
Role:CEO/ CTOx
Persona-1
Location: Mumbai
Company Size: SME / MSME
Industry: Business Operations, Sales, Digital Transformation
[Goal]
Drive innovation to improve customer experience and business growth.
Stay ahead of tech trends and competitors.
Improve internal communication and decision-making.
[Frustrations]
Difficulty comparing performance across teams or systems.
Lack of real-time, accurate data updates.
Limited visibility into key business metrics and forecasts.
Frustration with slow or inconsistent implementation.
Ravi Sharma
Role: EDP
Persons-2

Location: Mumbai
Company Size: SME / MSME
Industry: Business Operations, Sales, Digital Transformation
[Goal]
Automate repetitive data tasks and validations.
Improve speed and accuracy of data processing.
Enhance interdepartmental data sharing and consistency.
[Frustrations]
Frequent issues with tracking changes and merging data across systems.
Delays due to slow updates, missing or duplicate data entries.
Lack of standard data protocols and limited upload/customization options.
Card Sorting
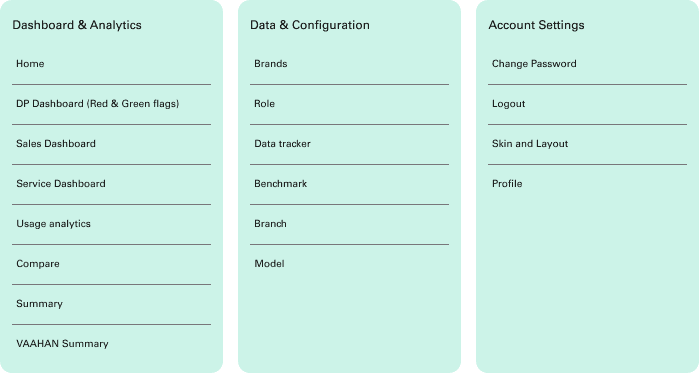
keys for better dealership management
Fix Naviagtion
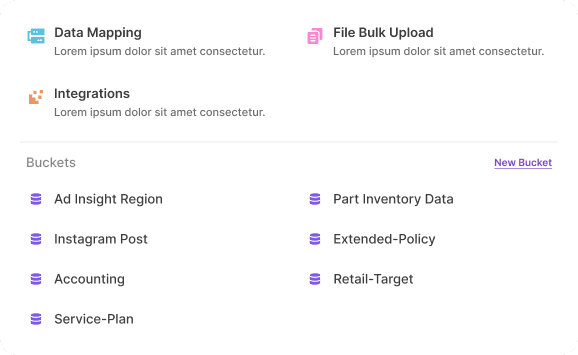
Bucket Management
Easy Data Mapping
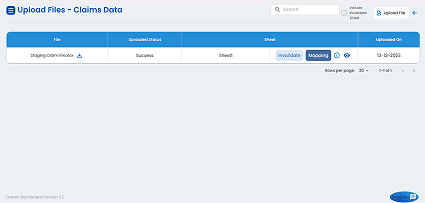
Simpler Data Upload
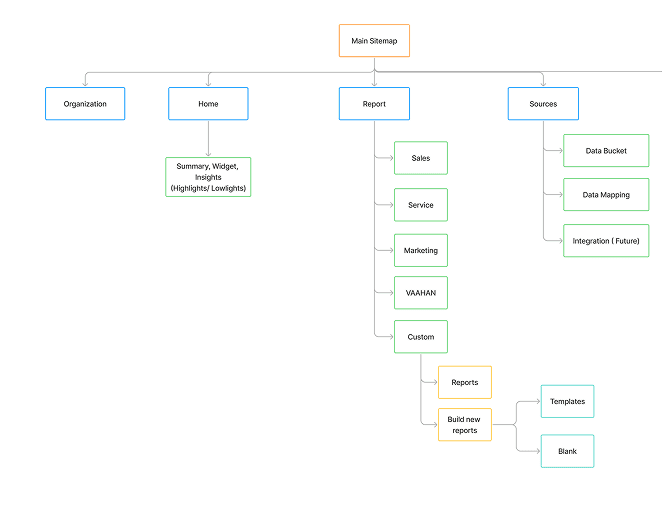
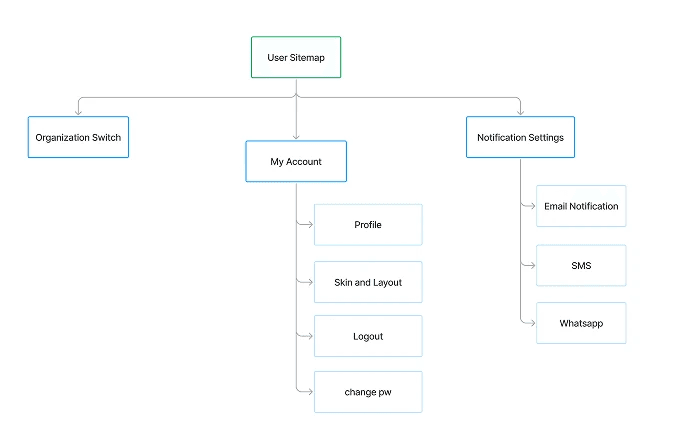
Sitemap
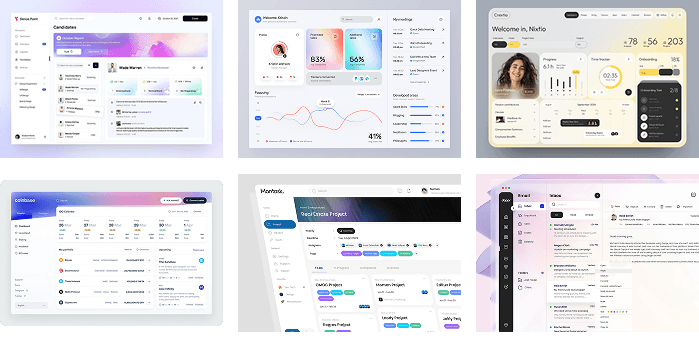
Setting the Vibe
Choosing the aesthetic of the platform
Typography

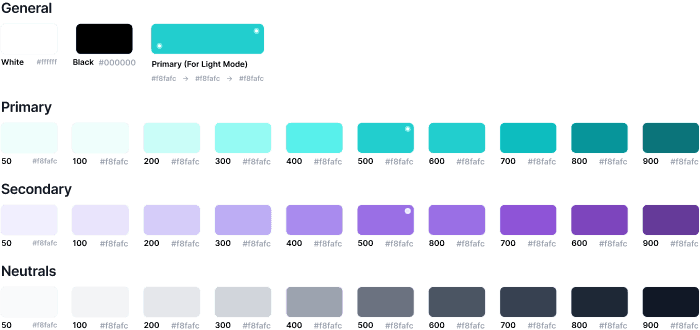
Colours
Sketching the Vision
Lets Execute the Thought
Enhanced and clearer navigation

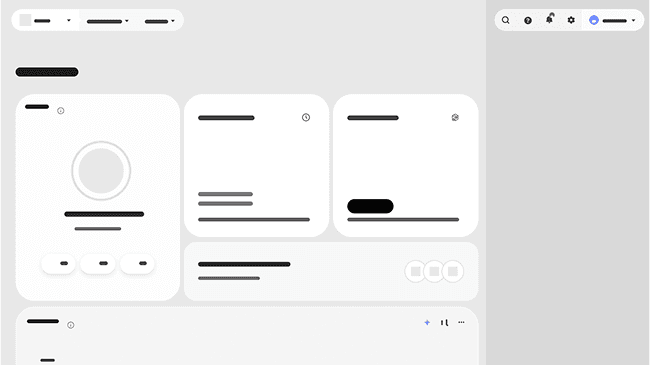
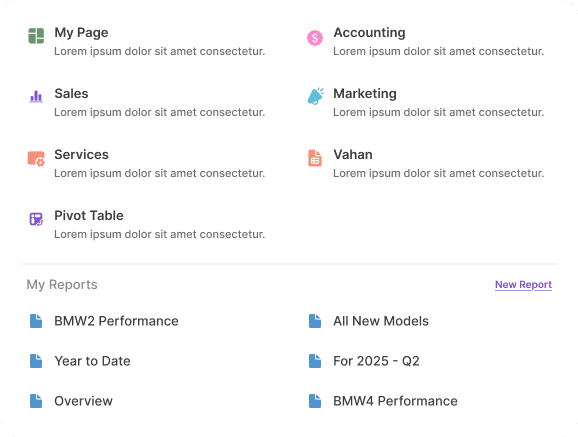
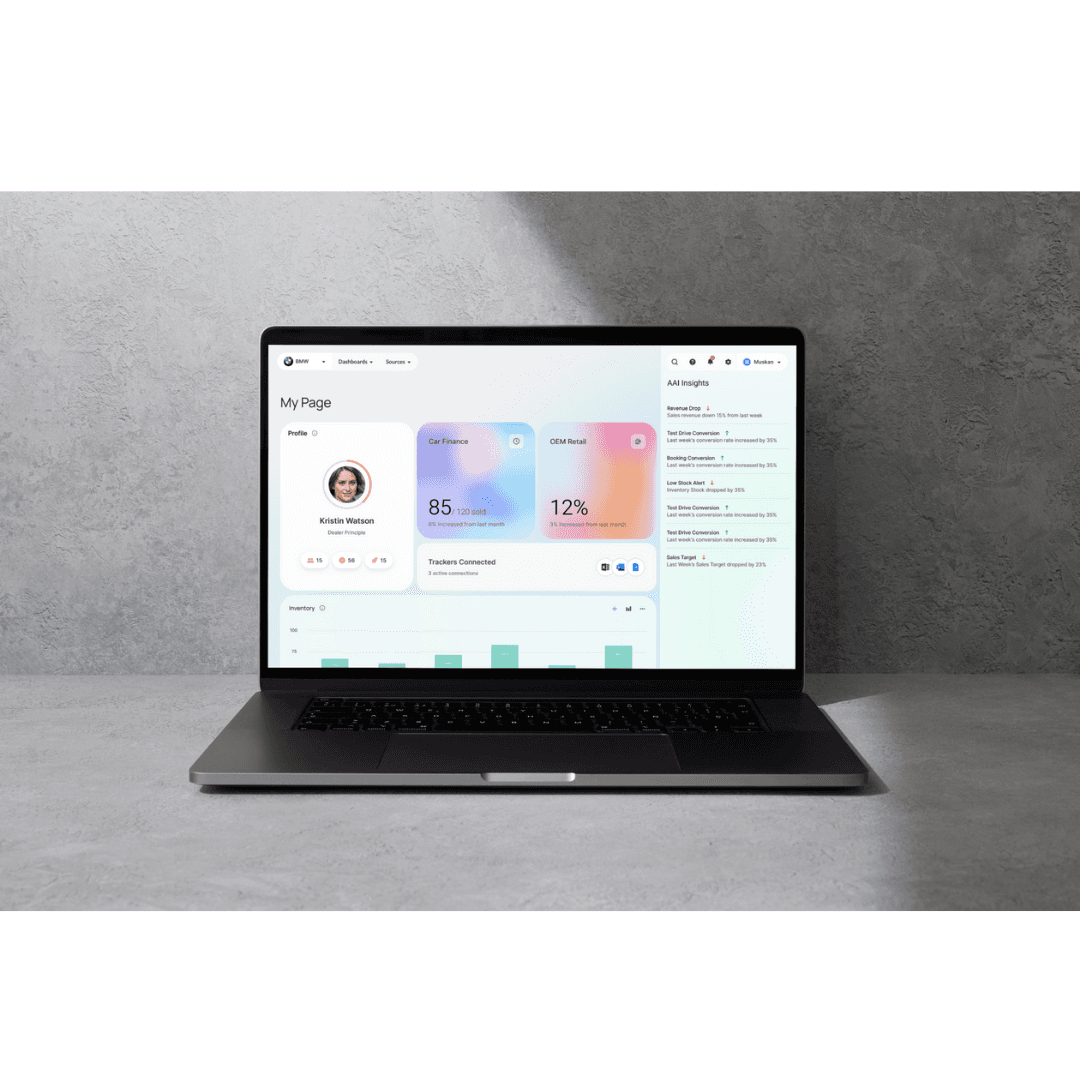
Dashboard
Sources
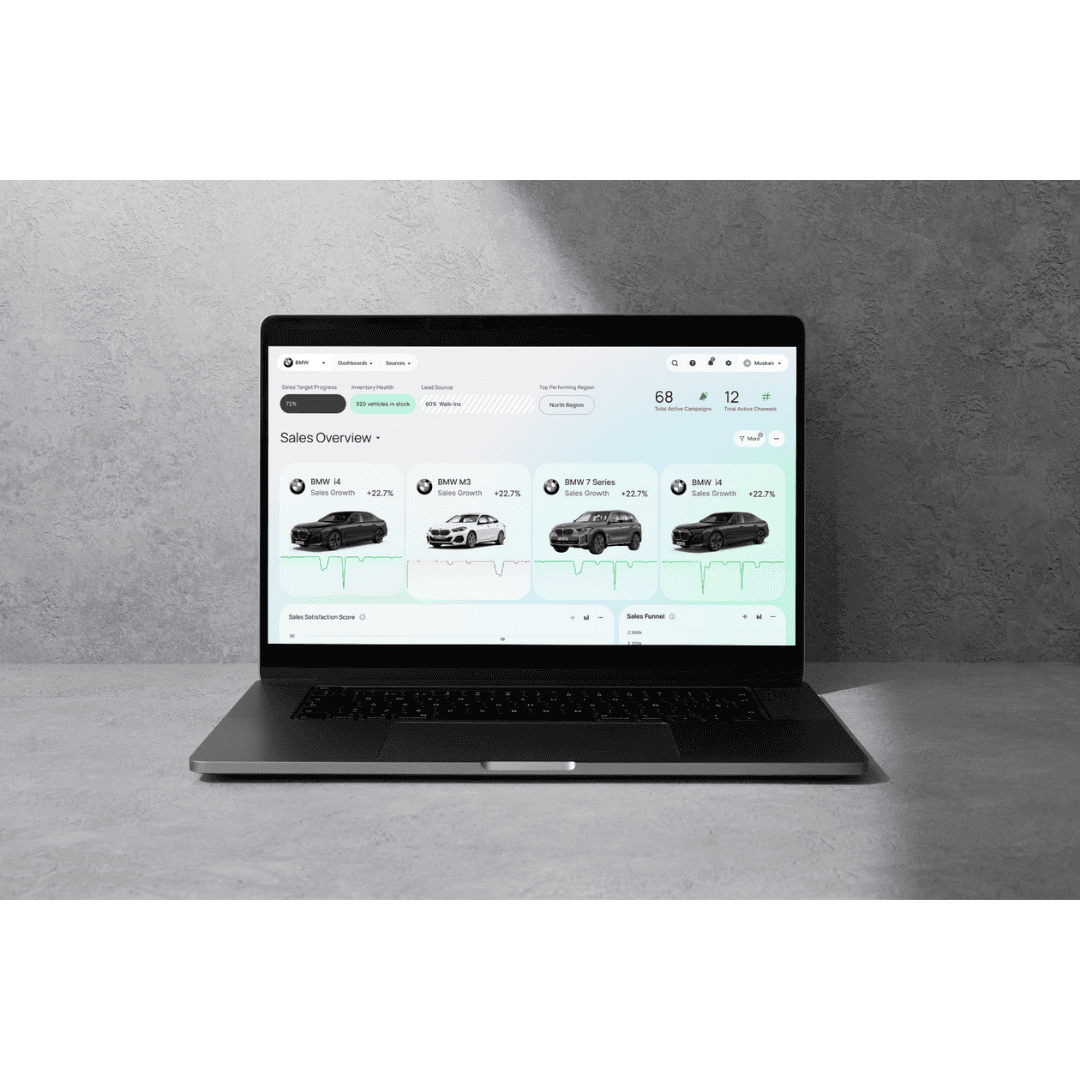
Sales Dashboard
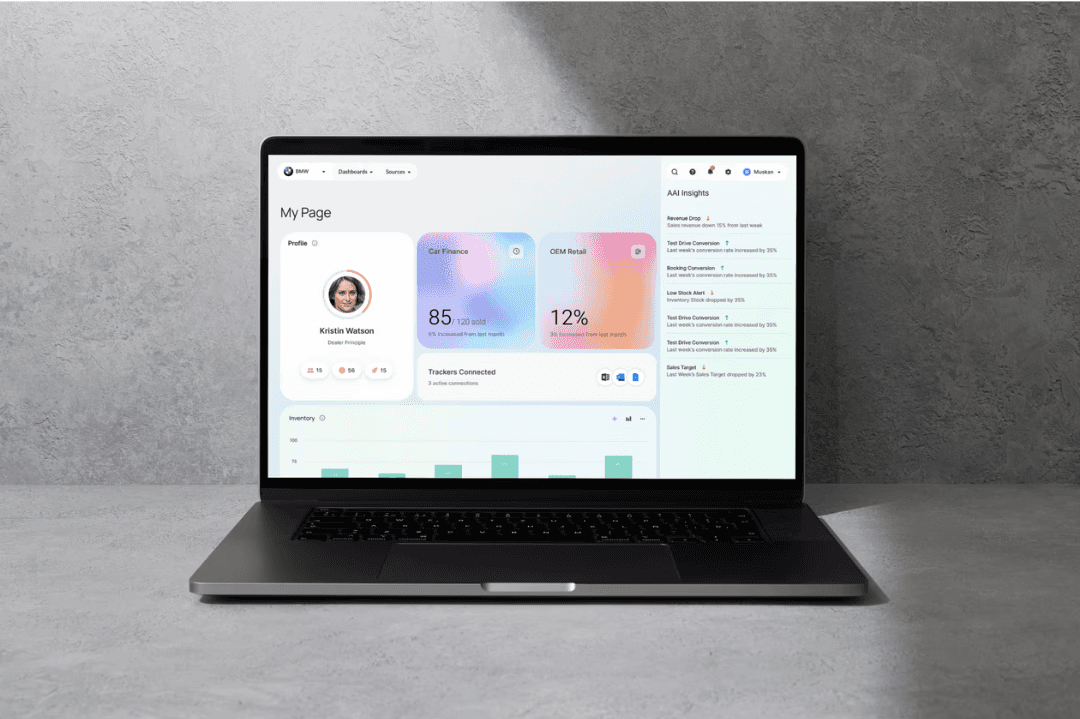
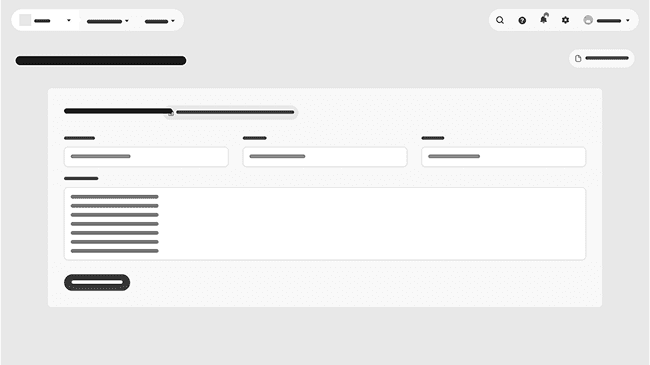
My Page
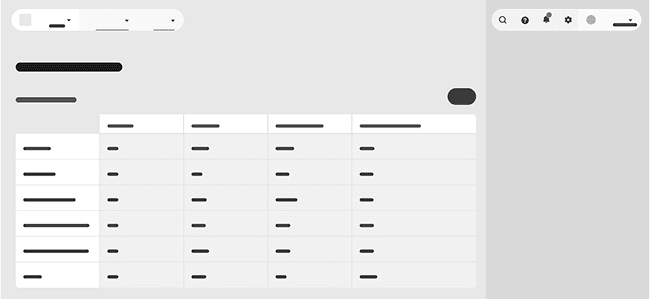
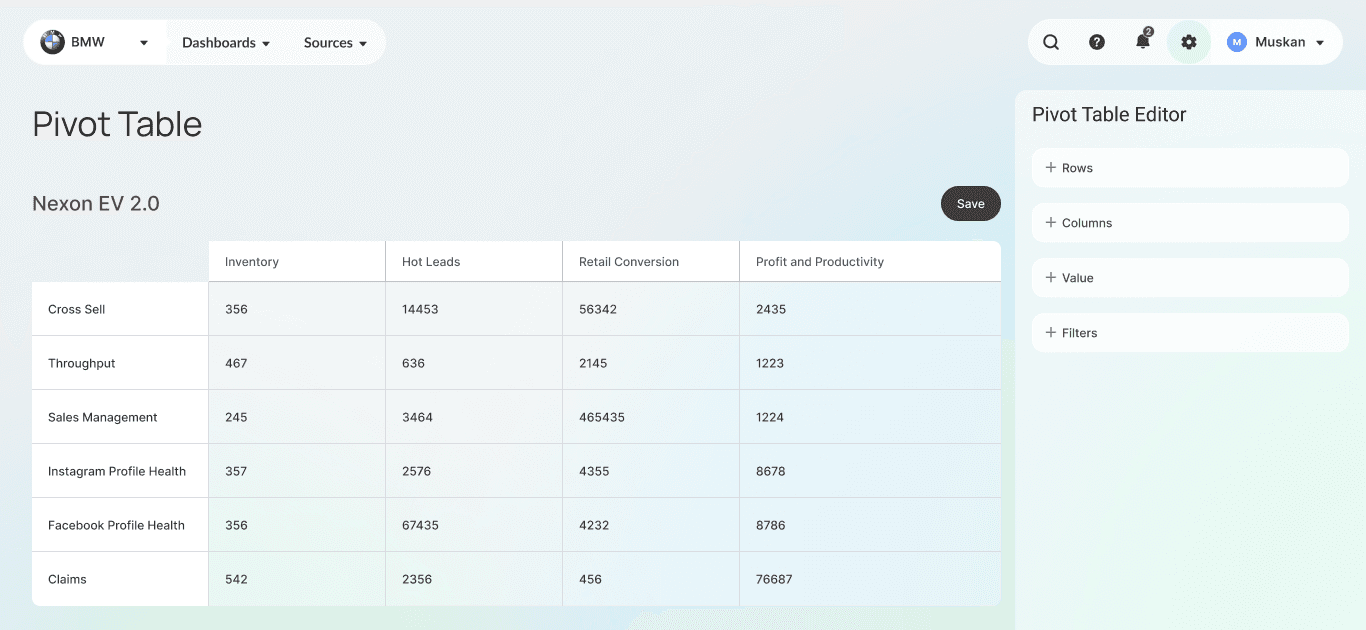
Pivot Table
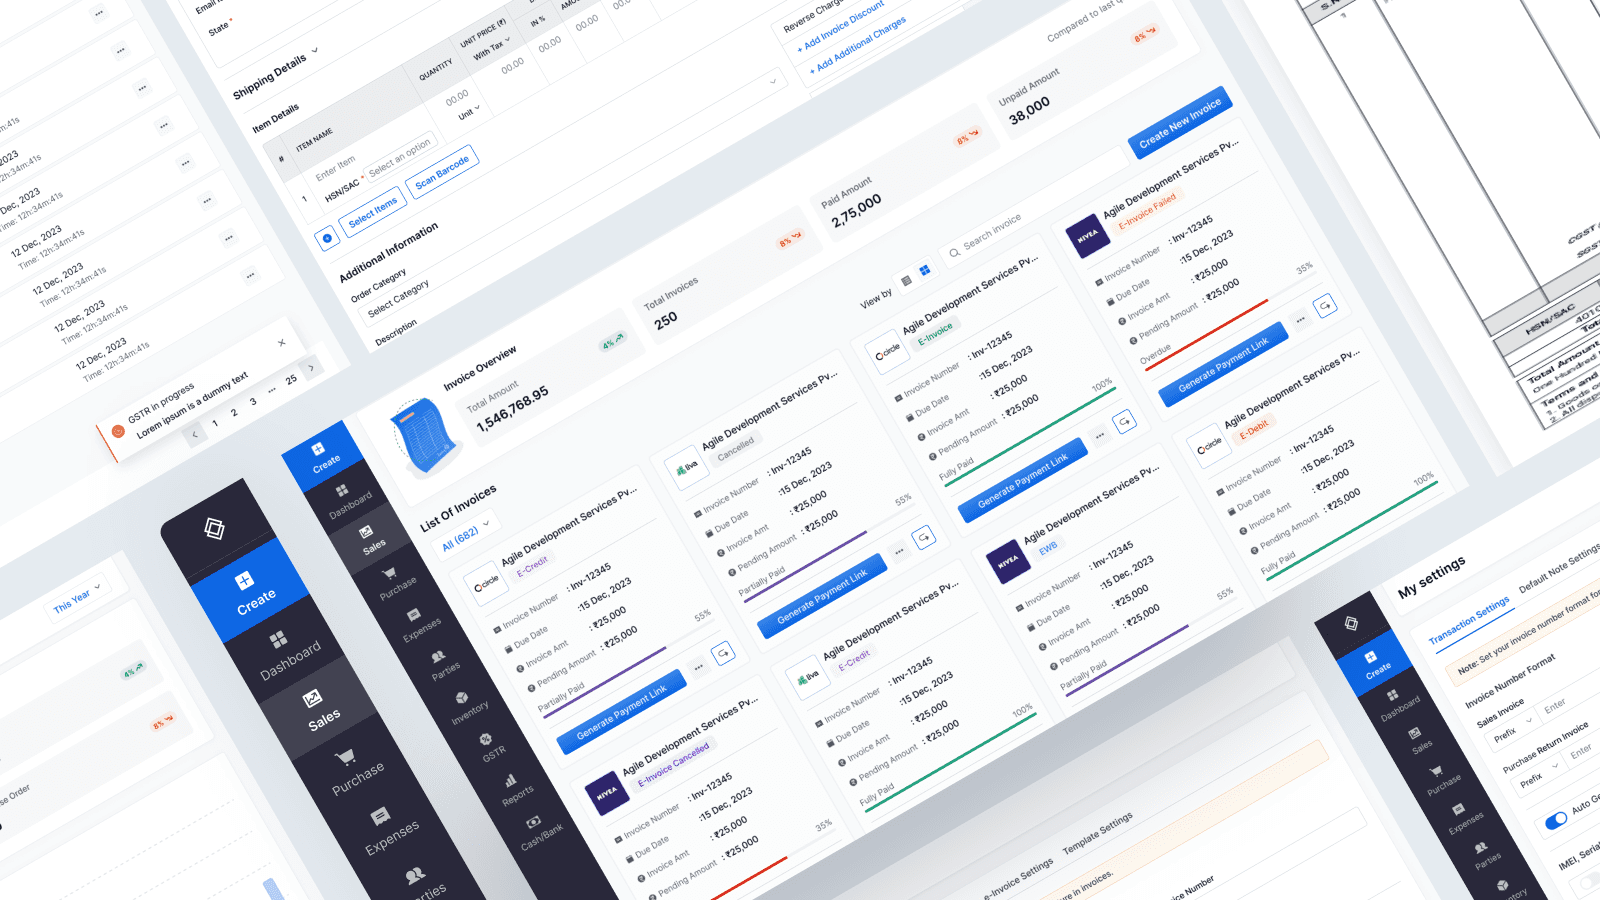
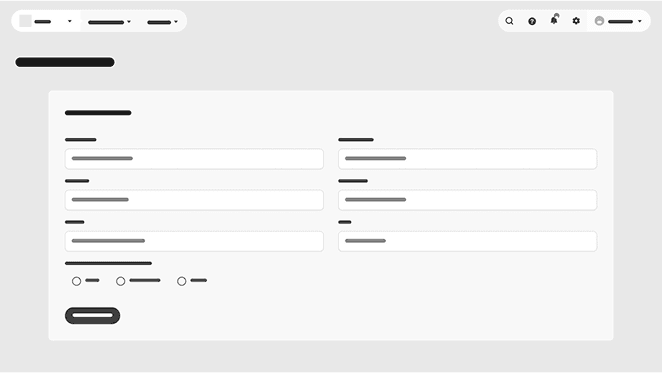
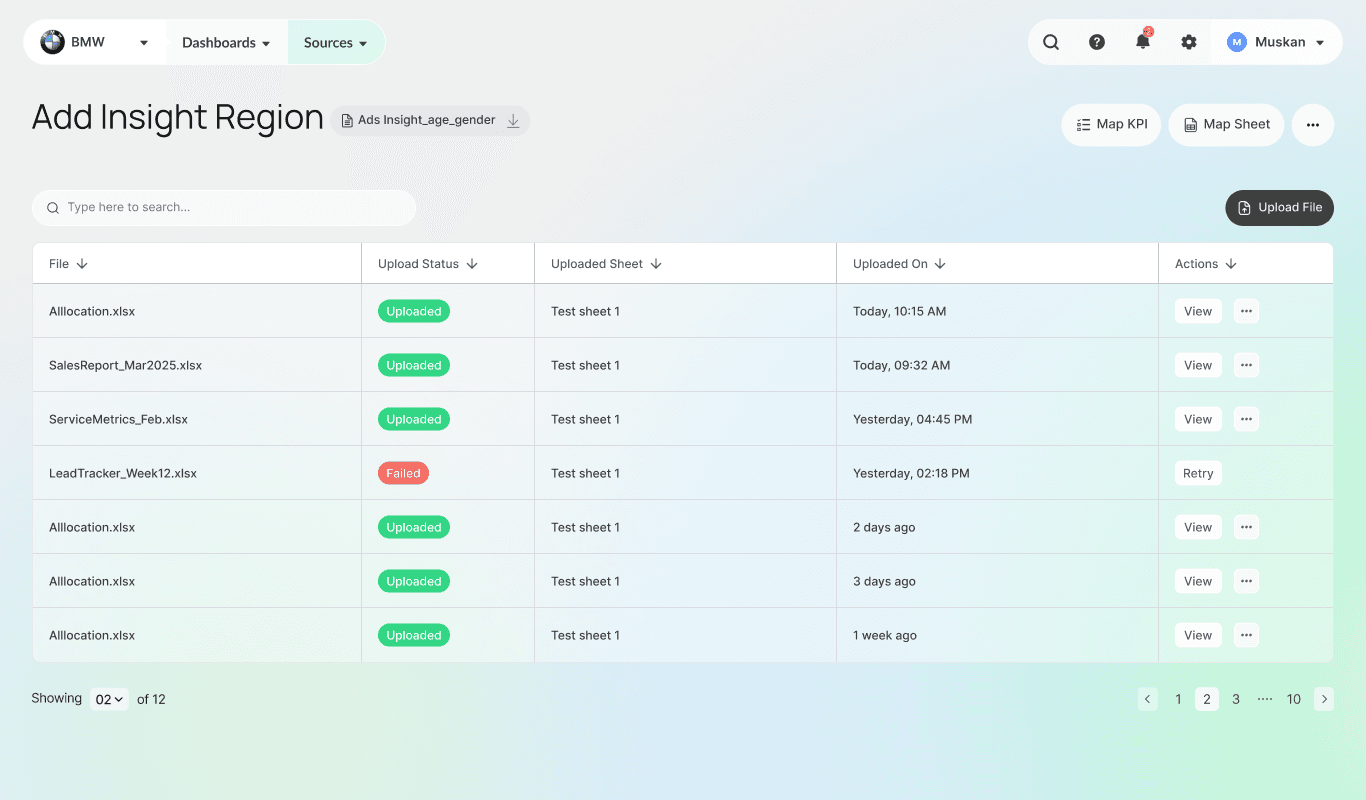
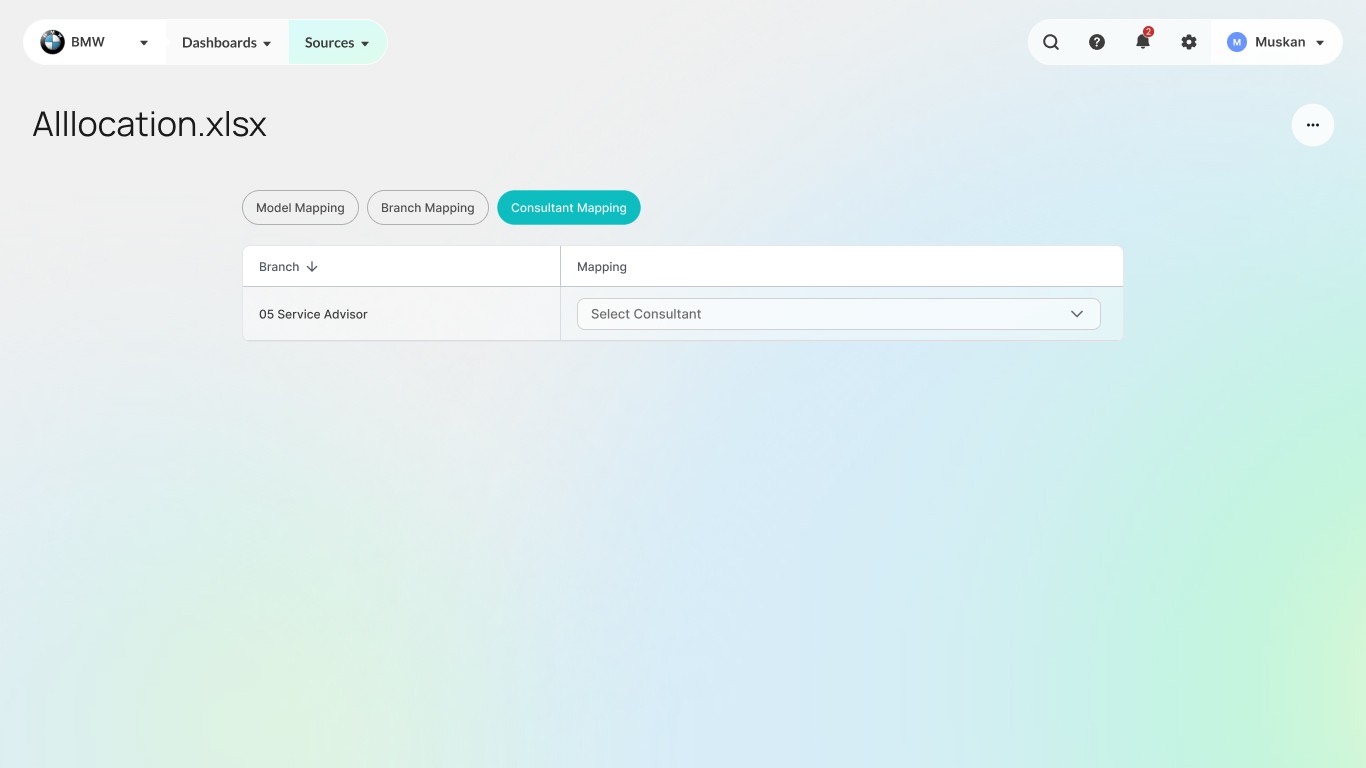
File Uploading and Mapping
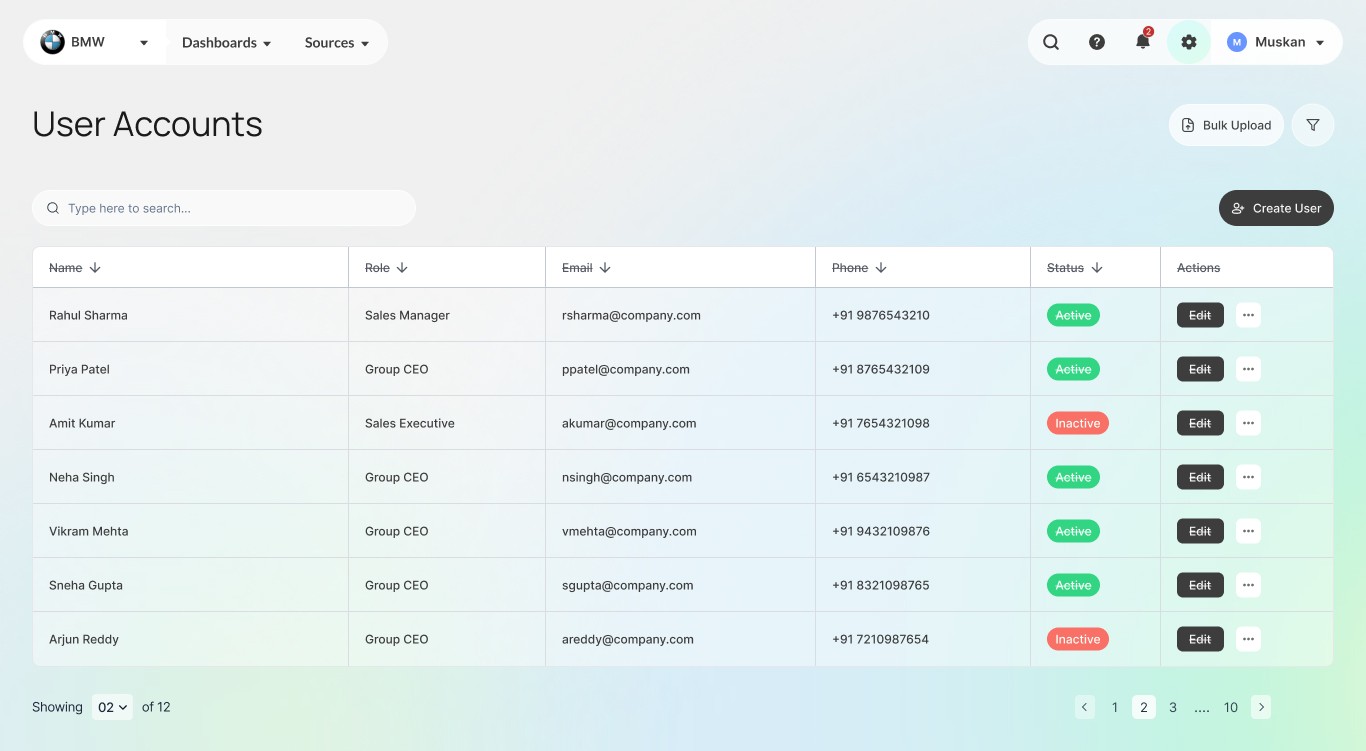
Admin
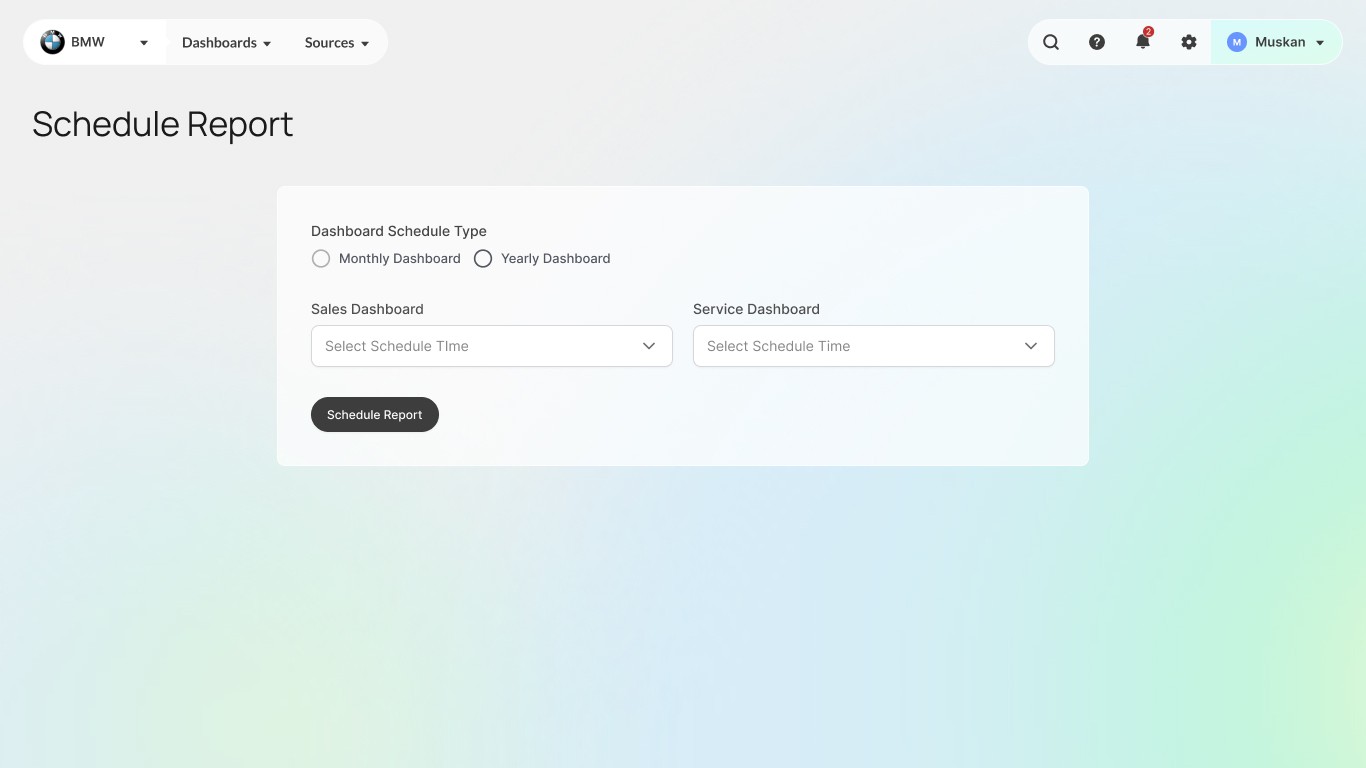
Schedule Report